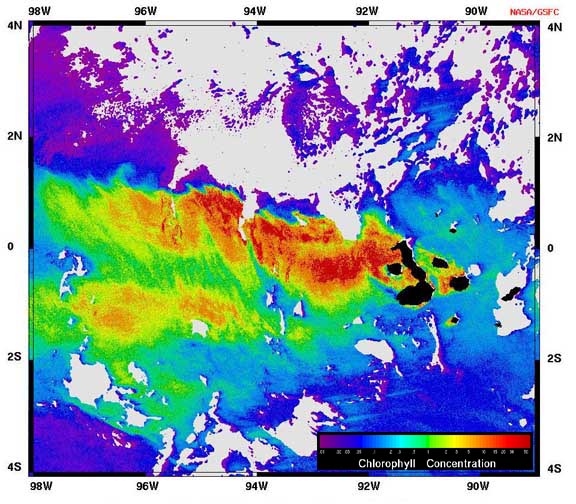
This image shows how physics, chemistry, and biology interact in the ocean. Compare the colors in the image with those in
the key which indicates phytoplankton (chlorophyll) (what are
phytoplankton?) concentration — red is highest, blue lowest. You can see in the
map which areas have the highest density of phytoplankton, and hence productivity. This is important information for
estimating future yields of commercial fisheries. The area of concentrated phytoplankton levels extends at least 500
miles west of the Galapagos into the equatorial Pacific Ocean. This so-called plume of high productivity is caused by a
surface current, the westward-flowing South Equatorial Current (SEQ). Other ocean currents that flow near the equator
affect Galapagos waters (see Ocean Currents Map). The SEQ is forced
upward as it hits the raised seafloor around the Galapagos and nutrients from the seafloor are brought to the surface by
a process called upwelling. The phytoplankton flourish due to the extra nutrients and are transported westward
with the current. This is the plume detected by the satellite.
OrbView-2 Imagery provided by ORBIMAGE, the SeaWiFS Project and NASA/Goddard Space Flight Center. © 2002 Orbital
Imaging Corporation. All rights reserved.
|


